Catch a Hacker: How to Trace an IP Address
March 22, 2013
Yahoo Expands New York Data Center
March 25, 2013Info-graphics: You see them every day on your social media and news outlets. An info-graphic is an easy to read illustration of graphical content that presents statistics in an easy to read manner.
 It’s safe to say that info-graphics are here to stay. You see them every day on your social networks and news sources.
If you don’t know what an info-graphic is, it’s usually an illustration or series of graphical representations that present statistics in an easy to read manner.
You may not even realize it but the graphics you see are often created for digital marketing purposes. They can range from clear and scientific to abstract and artistic.
Because of the aesthetic appeal, info-graphics lend themselves well to being shared on social networks and websites. Websites like Mashable and Google often have in-house creative and marketing departments that handle the research, design, and promotion through popular websites and social profiles.
So how does a small company or blogger with no graphic design experience go about creating info-graphics? Here’s a rundown of at least 9 apps you can use to create your own info graphics.
Infogr.am
Picking the right format for the information you want to present is important. Keep it short and display only the most important statistical data. Simple pie chart and flow diagrams work well too. A web-based solution for creating these types of simple charts is (1)Infogr.am. The site offers many free charts and graphs with colorful designs that you can use to plug in the data.

Tools to Help You Design your Info-graphic
If you feel more comfortable using a template rather than figuring out the design from scratch, try using (2)Piktochart. Their free trial offers design arrangements where all you have to do is plug in your information and pictures.
Another free website offering templates is (3) Easel.ly. This is a good option when conveying information in a format more conducive to storytelling rather than a rapid-fire presentation of facts. You can upload your own pictures and it provides many landscape/background options fitting a variety of themes.
If pre-made templates are not what you are looking for, try Hohli’s online (4)Chart Builder. If you have a bit of patience and time for trial-and-error (to navigate their data entry system), you can easily have a chart designed in no time. To get fancy with charts, try adding 2D or 3D images and shapes that you can easily create using the tools available on (5) Creately.
Statistics
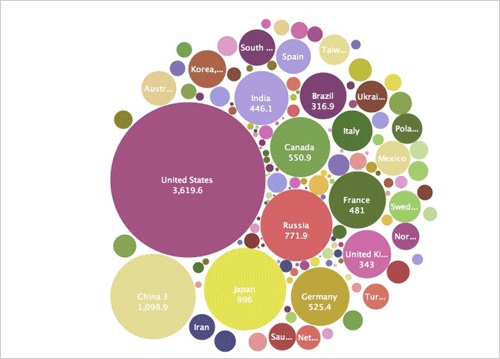
If you are looking for some visual statistics, Google is an excellent resource, offering fast and convenient statistical data on just about any topic you might want to highlight. Another good tool is (6)Chartsbin. By signing up for a free account you gain access to many maps (world, regional, and specific country) which can be loaded with your statistical data. For access to even more functions, try IBM’s (7)ManyEyes. This site offers extra options for displaying your data, finding stats, and the option of storing your data on their website.

Images
To avoid copyright concerns and find images that are able to be used freely, try the (8)Creative Commons Web Search. This site allows you to search for an image from any one of a number of image hosting websites where the users have cleared their images for commercial use.
Putting it All Together
Once you have all the pieces put together, it’s time to pull everything together into one image. Try using a free photo editing program like Gimp or (9)Pixlr Editor, an online tool.
Doing a little bit of research to see how other websites in your niche are presenting information will help you determine how your design looks compared to others out on the web. Try to have fun with your design. Nobody says reporting statistical data has to be a cut and dry process. In fact, isn’t the whole point to make your infographic to have it stand out from the crowd?
About the Author: Bernie Clark is the Co-Founder of Majux Marketing. Majux is a digital marketing agency that specializes in inbound and content marketing for lawyers, banks, CPAs, and other professional service providers.

