2013 Holiday Wish-List: 4 Must-Have Electronic Devices
September 19, 2013HIPAA Omnibus Rule Takes Effect; Now What?
September 27, 2013System administrators of CentOS Linux servers need to be aware of the tools at their disposal to measure CPU resource usage.
System administrators regularly need to monitor the use of their server’s processors to both keep an eye on load over time and diagnose potential problems. CentOS and other Linux distributions provide a number of tools for examining processor use, but their output can be difficult to understand for Linux novices.

We’re going to take a look at the tools that system administrators use to open a window into their server’s processor load and explain how to interpret the information that they present.
Uptime
The “uptime” command is usually used to see how long has a server has been running since the last reboot, but it also presents information about CPU load averages. Uptime Output
As you can see from the image above, “uptime” will display three numbers for the load average. The first thing to be aware of is that load average is not the same thing as the percentage utilization of the processor (we’ll get to that later).
The three numbers “uptime” reports are the load averages for the last 1, 5, and 15 minutes. Each processor (or core ) on a system can have a minimum load average of 0, and a maximum load average of 1, indicating that it is maximally loaded over the period of time reported. These load averages per core for each time period are then added together to give an overall load average. This can be complicated somewhat by hyperthreading in which each thread can also be reported as if it’s a separate processor core.
So, for a system with 4 cores that isn’t using hyperthreading, the “maximum” load average is 4. As a general rule, if you see the load averages at or close to the maximum load across all three time periods, your server is being overworked. It is possible for load averages to exceed the number of processors, cores, and threads, and that indicates that processes are waiting. A server can perform well at close to maximum load (although with no overhead for load spikes), but if the load averages exceed this, processes are sitting waiting for processor resources and the server can become unresponsive.
To investigate what might be causing the excessive load averages we can use the “top” command.
Top
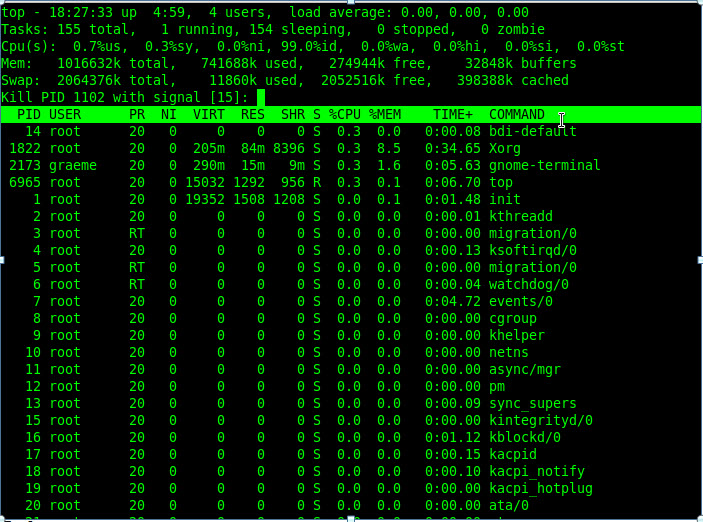
The “top” command is a very handy way of getting an insight into how a server’s resources are being used. It has a prettier and more functional sibling, called “htop”, which isn’t part of the main CentOS distribution, but can be installed from the EPEL repository. We’ll stick with ‘top’ here because by default it displays more information.
Top Output

In the image of the top command’s output you’ll see the CPU row with numbers that look like “5.6%us”. The percentage indicates the CPU usage and the letters indicate which class of process is using it. Interpreting this information can be tricky, but in a nutshell, what the most important of those numbers represent is processor usage by:
us – user: user processes.
sy – system: processes belonging to the kernel and other system components.
ni – nice: processes that have been reniced (i.e., had their priority changed).
id – idle: unused CPU
wa – waiting: processes waiting for I/O devices.
Below this is a list of processes with columns that display information about the resources used by each process, the processes owner, and so on. By default this list is sorted by CPU utilization, so you’ll quickly be able to see if one process is hogging resources.
Some care should be taken, but if you decide you need to kill a runaway process from within “top”, press “k” and enter the PID of the process (far left column).
(Note) A complete description of the load averages and processor utilization is too complex to deal with adequately in a blog article, but we hope that this covers most of what you need to understand about it to deal with CentOS servers day-to-day.
Additional Resources
Understanding Linux Load Averages
About Graeme Caldwell — Graeme works as an inbound marketer for InterWorx, a revolutionary web hosting control panel for hosts who need scalability and reliability. Follow InterWorx on Twitter at @interworx, Like them on Facebook and check out their blog, http://www.interworx.com/community.
